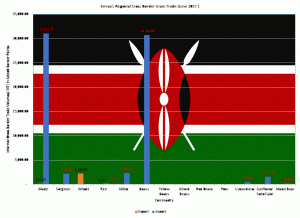
Maize meal continued to be a big topic of discussion in June 2017, and towards the end of the month Nairobi,  started experiencing shortages of rice, a probable indication, that Kenyans were unwillingly consuming more rice than maize meal. In June 2017, Kenya was the Leading Net Importer (66,312MT), a 324% increase in comparison to May 2017 net import (20,449MT). Kenya imported (68,626MT) and exported (2,314MT). The leading imports were maize and beans, while wheat (2,194MT) was the leading export.
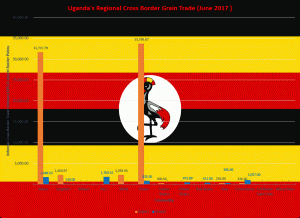
 Uganda was the Leading Net Exporter (64,304MT) in June 2017 having exported (70,952MT) and imported (6,648MT). The leading exports were beans (34,096MT), a huge increase in comparison to May 2017 (9,803MT). Uganda exported beans to Kenya (30,552MT), to DRC (3,232MT), and to Tanzania (10MT). Uganda’s combined commodity exports were to Kenya (65,243MT), to Rwanda (2,326MT), and to DRC (3,232MT). Maize (31,717MT) was the 2nd highest export commodity, a 225% increase from May 2017 (14,114MT). Uganda maize exports were to Kenya (30,317MT), to Rwanda (1,330MT), and Tanzania (70MT). Other exports to Kenya included Sorghum (2,115MT) and Millet (2,257MT). Uganda exported to Rwanda, Yellow beans (230MT), Peas (292MT), and Groundnuts (326MT). Uganda imports were from Tanzania (5,136MT), Rwanda (1,437MT), and DRC (74MT). There were no recorded imports from Kenya.
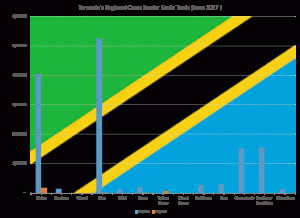
Tanzania was the 2nd Net Exporter (13,289MT) in June 2017, a huge increase from May 2017 (7,032MT). Tanzania only imported (270MT). Tanzania’s leading exports were Rice (5,249MT) consisting of rice to Rwanda (3,372MT), to Uganda (1,717MT), and to Kenya (160MT). Other commodity exports included Maize (4,060MT), which consisted of exports to Uganda (1,666MT), to DRC (1,600MT), and to Kenya (794MT). Tanzania also exported Groundnuts (1,515MT), consisting of exports to Uganda (1,037MT), and Kenya (478MT). The country exported Sunflower Seed Cake (1,558MT) to Kenya.
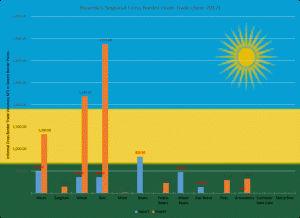
 Rwanda was a Net Importer (5,235MT) in June 2017, having imported (7,892MT), and exported (2,656MT). The leading imports were Rice (3,372MT), Wheat (2,194MT), and Maize (1,330MT). Beans were Rwanda’s leading exports having exported regular beans (825MT) and mixed beans (472MT). Other exports included Maize (497MT), Wheat (359MT), Rice (360MT), and Groundnuts (3MT). Rwanda’s exports were mostly to DRC along with the country’s usual bean exports to Uganda. Exports to DRC included Maize (497MT), Rice (359MT), Millet (360MT), and Groundnuts (3MT).
Commodity Price for maize in most East African markets, began dropping towards the end of June 2017 as Uganda started its harvest season. Kenya was the only exception as the market price for maize remains fairly high despite the Government of Kenya maize subsidy program. Most of the smaller and medium traders in Nairobi, remain wary of buying large stocks of maize, due to price uncertainly as the Government’s subsidy programs seems to have result in price controls. Maize prices were highest in South Sudan, Juba Ksh84($0.81)/kg, Burundi, Ngozi, Ksh75($0.72)/kg, and lowest in Tanzania, Dodoma Ksh27($0.26)/kg and Uganda, Tororo Ksh23($0.22)/kg. Prices in Kenya remained at Nairobi, Ksh57($0.55)/kg, Mombasa Ksh51($0.49)/kg, and Kisumu Ksh60($0.58)/kg.
Beans prices increased slight in the first week of June 2017, however Uganda’s beans harvest saw commodity prices begin to gradually decline from the second week all the way to the end of June 2017. Beans prices were highest in South Sudan, Juba Ksh162($1.56)/kg and Kenya, Mombasa, Ksh101($0.97)/kg, Meru Ksh89($0.86)/kg, and were lowest in Uganda, Kabale Ksh37($0.36)/kg, and Rwanda, Mulindi Ksh47($0.45)/kg. Rice prices remained fairly stable in the month of June 2017. Rice prices were highest in Kenya, Mombasa Ksh180($1.73)/kg and Nairobi Ksh155($1.49)/kg, and lowest in Tanzania, Iringa Ksh 74($0.71)/kg. Kenya’s aromatic pishori rice continued to fetch a very high price of Ksh195($1.89)/kg, forcing many Kenyans to switch to the less expensive Pakistan imported parboil rice, and regular long grain rice.
Wheat prices slightly declined in the first week of June, but remained fairly stable the rest of the month. Wheat prices were highest in Juba Ksh201($1.93)/kg, Burundi, Ngozi Ksh102($0.98)/kg, and lowest in Tanzania, Arusha Ksh41($.39)/kg, Kenya, Nakuru Ksh42($0.4), Nairobi Ksh44($0.42)/kg, and Eldoret Ksh49($0.47)/kg. Sorghum prices remained fairly stable in June 2017, wheat prices were highest in South Sudan, Juba Ksh85($0.82)/kg, Kenya, Nairobi Ksh82($0.79)/kg, Kisumu Ksh60($0.58)/kg, and lowest in Uganda, Soroti Ksh29($0.28)/kg. Red sorghum has completely disappeared from the Kenyan market despite the high prices being offered for commodity as East African Breweries Limited continues to contract more farmers to grow the Gadam (White) variety. Millet prices gradually declined in June, 2017. The prices were highest in South Sudan, Juba, Ksh138($1.33)/kg, Rwanda, Kimironko Ksh106($1.02)/kg, Kenya, Mombasa Ksh100($0.96)/kg, and lowest in Uganda, Soroti Ksh46($0.44).
So! What is the July 2017 Outlook for Kenya? The price of food is expected to reduce slightly as the East Africa region specifically Uganda continues to harvest food. A lot of food is also expected to begin trickling into the country from the Southern Africa region. Kenya has already started harvesting green grams in certain parts. Overall, Kenyans can expect to breathe a sigh of relief as certain food prices begin to look hopeful. As usual Maize being a highly political crop remains the exception to the rule, as there are way too many external political factors affecting the maize market, with the country’s election only three weeks away.
Exchange Rate used US$1=Ksh103.95/-
Written by Fostina Mani, Betta Grains. Fostina.Mani@bettagrains.com, Twitter: @FostinaMani,
Acknowledgment: The data used for the analysis has been obtained from; IAM, Government of Kenya, Ministry of Agriculture, Livestock & Fisheries, Government of Tanzania, Ministry of Trade and Industry, EAGC, RATIN, Farm Gain Uganda, FEWS NET, & Betta Grains.
Disclaimer. Due to unavailable of data on various border points on formal cross-border trade flows and volumes in the public arena. The volumes indicated above are mostly from the informal cross-border data that is available to the public. The purpose of the analysis, is simply to provide an indication of the East Africa Regional Trade flow to SMEs, Smallholder Farmers, and Other Stakeholders in a manner and language that is applicable, simple, and makes sense. Those desiring to obtain actual trade volumes are advised to contact various internationally funded projects and government ministries that have been mandated to provide the regional trade data for public good.
